The Future Of Oil And Gas? Look To The Past

By Chris Ross, Executive Professor, C.T. Bauer College of Business

In the early days of 2017, it behooves oil and gas companies to reflect on the past, while making plans robust to an uncertain future outlook. There are several questions that should be asked:

  • Where are we in the oil and gas price cycles?
  • How will politics and policies affect the business outlook?
  • What are the appropriate strategies?

Learning from the Past

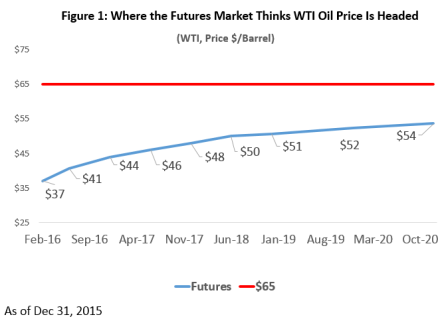
It will not surprise any investor in oil and gas and related businesses that theirs is a cyclical business. Prices run up when supplies fall short of demand, hover on the summit for a few years, then tumble as new supply sources are developed and demand growth slows down (Figure 1).

Sources: BP Statistical Review of World Energy; EIA

After the collapse of 1986, oil prices remained volatile through 1990, then declined further through 1998 as production from the Middle East, Norway, Iran and Venezuela increased to meet demand growth and replace declines in Russia and North America. One consequence of the price decline in 1998 was major oil company mega-mergers. These resulted in high-grading of projects, reduction in aggregate capital spending and slowdown in production increases, setting the stage for the run-up in prices after 2002.

The period from 1986 through 2002 can be seen in retrospect to have been a “long grind,” as oil prices were set by the long-term marginal costs of incremental production sources needed to satisfy demand growth and replace declining production from mature oil fields and political turmoil.

Tightly controlled wellhead natural gas prices in the 1970s led to supply shortages. The 1978 Natural Gas Policy Act (NGPA) started a process of decontrol and broadened the responsibility the Federal Energy Regulatory Commission held over the industry.

In 1985, FERC issued Order No. 436, which changed how interstate pipelines were regulated. This established a voluntary framework under which interstate pipelines could act solely as transporters of natural gas, rather than filling the role of a natural gas merchant. However, it wasn’t until Congress passed the Natural Gas Wellhead Decontrol Act (NGWDA) in 1989 that complete deregulation of wellhead prices was enabled. Issued in 1992, FERC Order No. 636 completed the final steps towards a competitive market by making pipeline unbundling obligatory.

Natural gas became a traded commodity subject to its own cycles (Figure 2).Sources: BP Statistical Review of World Energy; EIA

The decontrolled market opened new sources of supply, enabled by new seismic technologies that uncovered large resources of natural gas under the Gulf of Mexico (GoM) continental shelf. A gas bubble was inflated, holding spot prices below $3/million British Thermal Units from 1989-1999. New markets, notably independently owned cogeneration plants empowered to sell electricity to industrial plants and the grid at prices representing the “avoided cost” that new utility projects would have incurred, caused rapid demand growth.   The bubble burst as gas production in the Gulf of Mexico peaked, natural gas prices increased and LNG import terminals were built.

Higher prices induced innovation on the supply side as George Mitchell figured out how to extract natural gas from tight shale rock, and the technologies were deployed in other gas and then oil shale plays. Natural gas prices collapsed in 2009: demand accelerated as natural gas displaced coal in the power sector, somewhat constrained by limitations on pipeline transportation. New pipeline connections were built despite opposition; LNG import facilities were converted to export facilities.

Mark Twain wrote “History doesn’t repeat itself, but it does rhyme.”  If history were to repeat itself, oil prices would remain low for another “long grind”, mirroring 1986-2002 by declining further over the next 15 years; natural gas prices would start strengthening in 2019.

Politics and Policies

For oil markets, turmoil in the Middle East and Africa withdrew about 3 million barrels per day from world markets between 2005 and 2015. Ideological conflicts, coupled with the demographic realities of a growing number of young men with few employment opportunities, suggest continued instability.

OPEC’s agreement to reduce production with apparent support from Russia will be tested by inducing expansion of U.S. shale production. But the need for cash to meet social commitments is likely to reduce funding available for capital spending by the national oil companies and will lead to lower production, regardless of the OPEC quotas. The “long grind” seems likely to be shorter this time around, more likely five rather than 15 years.

The past eight years have seen a series of rules designed to suppress coal use, to the benefit of natural gas as well as renewables. Several of these rules are still being litigated, and the new administration may choose not to defend constitutional challenges by various individual states. There may also be a reduction in subsidies and mandates favoring renewables, but natural gas will likely find it difficult to displace coal at the pace seen in recent years. LNG exports will allow further production growth, but the resource available in shale plays in 2017 is significantly larger than the GoM shelf resource available in 1989. Expect natural gas volumes to grow but prices to remain capped by coal through the mid-2020s.

Strategies

For upstream companies, the not-so-long grind through the early 2020s calls for a conservative approach to strengthen balance sheets, sustain dividend payments and drill within cash flows. Prices will be volatile and excessive exuberance will be punished by periods of low prices. However, it will be important to see around corners and monitor closely the factors that could shift the outlook to a new run-up in prices, requiring an expansionary emphasis on capturing new resources and a greater tolerance for debt.

The oilfield services sector has been hammered by the downturn and will likely consolidate further. It remains to be seen whether the consolidation will be lateral or vertical. Halliburton failed in its attempt to strengthen its verticals by merging with Baker Hughes; Schlumberger and Technip have taken a French solution of lateral extension by acquiring Cameron and FMC Technologies, respectively, and the forthcoming merger between GE Oil & Gas with Baker Hughes is also mainly lateral extension of business lines. Historically, oil companies have preferred to purchase equipment and services from best-in-class providers, and the new conglomerates will need to work hard to overcome past preferences and create a persuasive value proposition for bundling purchases of equipment and services from a single vendor.

Midstream companies should be able to resume organic growth as companies “replumb” energy infrastructure, aided by a supportive rather than hostile federal government and underwritten by producers seeking access to liquid markets.

Refiners and petrochemicals companies should benefit from an increasing gap between natural gas (used as feedstock and energy) prices and crude oil (setting international petroleum and petrochemicals products prices) as the oil price cycle will be out of phase with the gas price cycle. Nevertheless, these sectors will see limited volume growth and should continue to focus on limited capital improvements, operations excellence and accretive, synergistic acquisitions.

Well managed companies created value for shareholders through the 1990s by leveraging new technologies, simplifying their organizations to improve productivity, partnering creatively with providers of equipment and services and making acquisitions when prices were low. That playbook should be dusted off and updated for the next five years.


 As a consultant, Professor and Energy Fellow Chris Ross works with senior oil and gas executives to develop and implement value creating strategies. His work has covered all stages in the oil and gas value chain.

UH Energy is the University of Houston’s hub for energy education, research and technology incubation, working to shape the energy future and forge new business approaches in the energy industry.

Why Are Oil Prices So Hard To Forecast?

By Bill Gilmer, Director of the Institute for Regional Forecasting

For the oil forecasting community, the most recent collapse in oil prices marks one more failure. The long trail of forecast errors includes the market implosions of 1982 and 1986, not seeing the run-up in commodity prices after 2004 and now missing the end of the same commodity boom. For those of us who depend on oil price forecasts, this is a big problem.

Try to forecast the economic outlook for Houston or the Gulf Coast, for example, without a good handle on oil prices. Right now, I am coping with oil price uncertainty by preparing several scenarios for Houston’s economic outlook, mostly conditioned by guessing when and how fast oil prices might recover.

The process took me through a number of current oil price forecasts from banks, investment houses and consultants, and the differences in opinion are wide and discouraging. I was left asking: Why is it so hard to forecast oil prices?

Oil Futures as a Spot Price Forecast     

This latest forecasting led me to the crude oil futures market, an often-quoted and much-maligned forecast of oil prices. In principle, it should be a very good predictor. But in fact, using the futures price as a forecast of the spot price of oil is a very small improvement over predicting that oil prices will be the same tomorrow as they are today. That sounds terrible, until you learn that futures market predictions beat all the alternatives, including other financial models, statistical models and expert surveys. Why can’t we do better?

Figure 1 shows prices on the futures strip for NYMEX crude oil on December 31, 2015. At each date, the price is the payment that would be made and received for a barrel of West Texas Intermediate (WTI) delivered at that time. In the 1930s, it was thought that the spot or current price and all futures prices were independent, each determined by economic fundamentals prevailing at that point in time.

In the 1940s, agricultural economist Holbrook Working showed that spot and futures prices were closely linked by the cost of storage. If the 12-month futures price was higher than the spot price plus the cost of 12 months of storage, for example, I should buy inventory today, store it and sell it at a profit later. By the 1970s, economists had worked out how producers, consumers, hedgers and speculators take a history of past prices, inventories and market fundamentals, arbitrage across time, and the market simultaneously solves for the spot price and futures prices.

It also turns out futures prices can be regarded as a forecast of oil prices. For example, the December 2017, futures price in Figure 1 is $48 per barrel, implying that will be the spot price on that date. If you live in Houston, this is a very gloomy outlook. We probably need $65 per barrel to put the fracking industry back to work, and perhaps allow it to grow moderately. Futures don’t see a price near that level before 2020. How seriously do we take this forecast?

gilmer-1

Futures as Forecaster

Work on futures prices as a forecasting tool is confusing because it swings back and forth between two concepts of “good forecaster.” One stems from the efficient markets hypothesis, where if we can show futures markets are efficient, then by implication they are good forecasters.

Alternatively, we just ask if the futures price does a good job of forecasting the spot price. If we look at out-of-sample results, does it reproduce the past well? Better than other forecasting tools?

There are two important concepts of efficient markets:

  • Weak-form efficient markets reflect all publicly available data on past prices and market fundamentals, and arbitrage eliminates the profit opportunities. In theory, standard forecasting techniques relying on public data cannot improve on the futures price.
  • Strong-form efficient markets contain all information, public and private. The weak form properties are subsumed here, but the question now becomes whether there are pools of private information that keep markets from being strong-form efficient. This might be a proprietary model, an analyst with extraordinary insight, or an investment bank that pours tens of millions of dollars into research.

In 1997, William Tomek, a pioneer of futures market research, reviewed decades of work on corn, soybeans, hogs and other agricultural products, and drew the following conclusion:

“The preponderance of evidence suggests that markets are weak form efficient. Thus other publicly available forecasts cannot improve on futures quotes as forecasts. This does not mean, however, that futures quotes or other forecasts have a high degree of accuracy.”[1]

Tomek’s review was based on mature commodity markets that had been operating for decades. The question at hand is whether relatively new energy futures markets, and especially the market for crude oil, would allow us to draw similar conclusions.

Crude oil Futures

Futures markets for grains and cotton were in full swing by the 1870s, but exchanges for crude oil and other energy products weren’t established for another century. Heating oil was the first NYMEX energy product in 1978, followed by WTI crude in 1983 and later by gasoline and natural gas. The delay for crude and oil products was because much of the world’s oil changed hands at posted or official prices until 1986, with the prices negotiated between large national oil producers and major oil companies. The demise of this system allowed today’s futures market for crude to grow and rival the largest exchanges in the world, including commodities such as corn and copper.

Early studies of crude oil futures as a forecast of spot prices were deeply divided. From one study to another, the markets were/were not efficient, or futures prices were/were not good forecasters. Many of these studies were premature, as it takes years to accumulate the data needed for good studies. To get around the lack of data, early studies too often relied on prices from the fixed-price regime of the 1970s and 1980s.

To see what we know about these markets today, I found four relatively recent studies of crude oil and oil product markets; none of them used data from before 1990.[2] This brief summary sounds very much like Tomek’s conclusions for agricultural products.

  • Crude oil markets are probably weak-form efficient. Three of the four studies support the notion across all the futures horizons studied.
  • The studies typically show that the futures price forecast can beat a random walk, i.e., it is better than a naïve forecast that says tomorrow will be the same as today.
  • But futures are rarely better than a random walk by statistically significant margins. We can’t be 90% or 95% sure futures are better.
  • Both futures prices and a random walk predict spot prices better than other financial or statistical models. For example, the study from the IMF looked at two alternative financial models and six alternative time-series models. Once more, futures beat out the random walk by a small margin, but the accuracy of other models fell far short of either futures or a random walk.

Why oil prices are hard to predict

We have dug ourselves into a pretty deep hole. Futures prices are a poor predictor of spot prices, barely beating a random walk, but standard statistical models are even worse. Since futures markets are weak-form efficient, no financial model, statistical technique or subjective survey based on public data should do better.

Why are all the forecasts so poor? It is because the world will not stand still. All of the evaluations of crude futures markets assume that on a particular day the market takes past prices, inventory data and other fundamentals to produce a set of spot and futures prices. We write down the 12-month futures price, for example, then wait a year and check the spot market to see if the forecast was right.

But that forecast was completely predicated on information available a year ago. We can all think of moments that have suddenly and unexpectedly turned oil markets on their head: the Arab oil embargo, the fall of the Shah  or the invasion of Kuwait. An efficient market scrapes together all available data and uses it to look forward, but no one should pretend it can somehow divine the future.

And it doesn’t take big headlines to upset the forecast. The global crude oil market depends on the politics of dozens of producing countries, economic cycles in consumer countries and a vast infrastructure of pipes, ships and refineries. Even if we account for the known issues correctly, we could list 1,000 or more low-probability events that could push our forecast off course.

Suppose that each of these events has a probability of one in a 1,000 over the next 12 months. There is no reason to incorporate any of these possibilities into our forecast or even list them as a risk. But if these events are independent of each other, the chance that at least one will significantly and unexpectedly affect the oil market within a year is 1-(.999)1000 or 63.2%.

When I opened the newspaper December 31 and looked at the futures prices in Figure 1, what was I reading? Was the 12-month futures contract at $44 telling me what the spot price of crude oil will be a year from now? Probably not very accurately, because it is not clairvoyant; unanticipated events in crude markets over the next 12 months – those constantly changing facts – leave the futures price barely more capable than a random walk.

When important new information changes the December 31 outlook, has the futures forecast failed? No, the world changed and the futures market quickly updated its forecast to include new data – efficiently, as far as we know. As long as the world does not stand still, neither will the futures price.

But if on December 31, you wanted the best oil price forecast possible based on the facts available that day, you wanted the crude futures prices. The forecast is available daily, updated continuously and all for the price of a newspaper.

[1] William G. Tomek, “Commodity Futures Prices as Forecasts,” Review of Agricultural Economics, 19, #1 (Spring-Summer, 1997), p. 24.

[1] S. Abrosedra and H. Baghestani, “On the Predictive Content of Crude Oil Futures Prices,” Energy Policy, 32 (2004), pp 1389-1393; M. Chinn, M. Le Blanc, and Olivier Coibion, The Predictive Content of Energy Futures: An Update on Petroleum, Natural Gas, Heating Oil, and Gasoline, Working Paper #1103, National Bureau of Economic Research, January 2005; T.A, Reeve and R.J. Vigfusson, “Evaluating the Forecasting Performance of Futures Prices,” Working Paper #1025, Board of Governors of the Federal Reserve System, August 2011; D.A, Reichsfeld and S.K. Roache, “Do Commodity Futures Help Forecast Spot Prices?” Working Paper 11/254., International Monetary Fund, November 2011.

Bill Gilmer is director of the Institute for Regional Forecasting at the University of Houston’s Bauer College of Business. The Institute monitors the Houston and Gulf Coast business cycle, analyzing how oil markets, the national economy and global expansion influence the regional economy.